Home
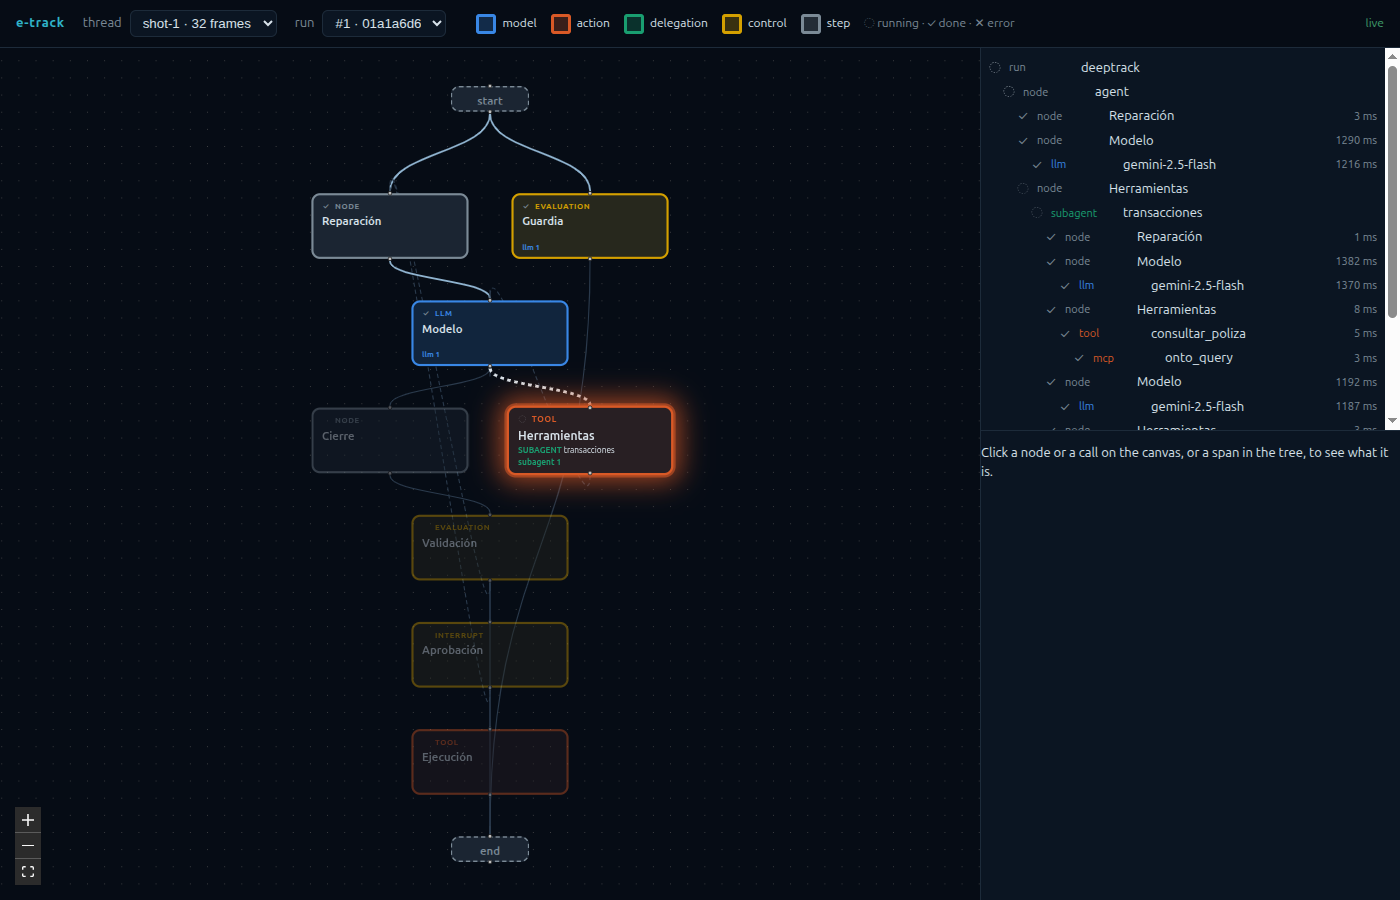
See what your agents are doing. e-track turns every run of a LangGraph agent — its nodes, model calls, tools, MCP calls and subagents — into one stream of events, and sends it wherever you look: Langfuse, Phoenix, any OpenTelemetry backend, your own code, or a live canvas of the graph.
Part of the EDamLabs eager series: EDamLabs' own e- products (EDamLabs families).
One record
Every span of a run becomes a RunEvent: what it is, where it sits in the tree, what it carried, what it cost. Backends and clients read the same thing.
Every backend at once
OpenTelemetry spans and logs in the GenAI, OpenInference and Langfuse dialects together — Langfuse, LangSmith, Phoenix, Tempo, any collector.
A live canvas
The agent's graph drawn as declared, lit as it runs, with a picker for every conversation. One line to serve it.
Never in the way
Emitting costs the run ~5 µs. A slow or broken backend drops and counts — it never slows the agent or another backend.